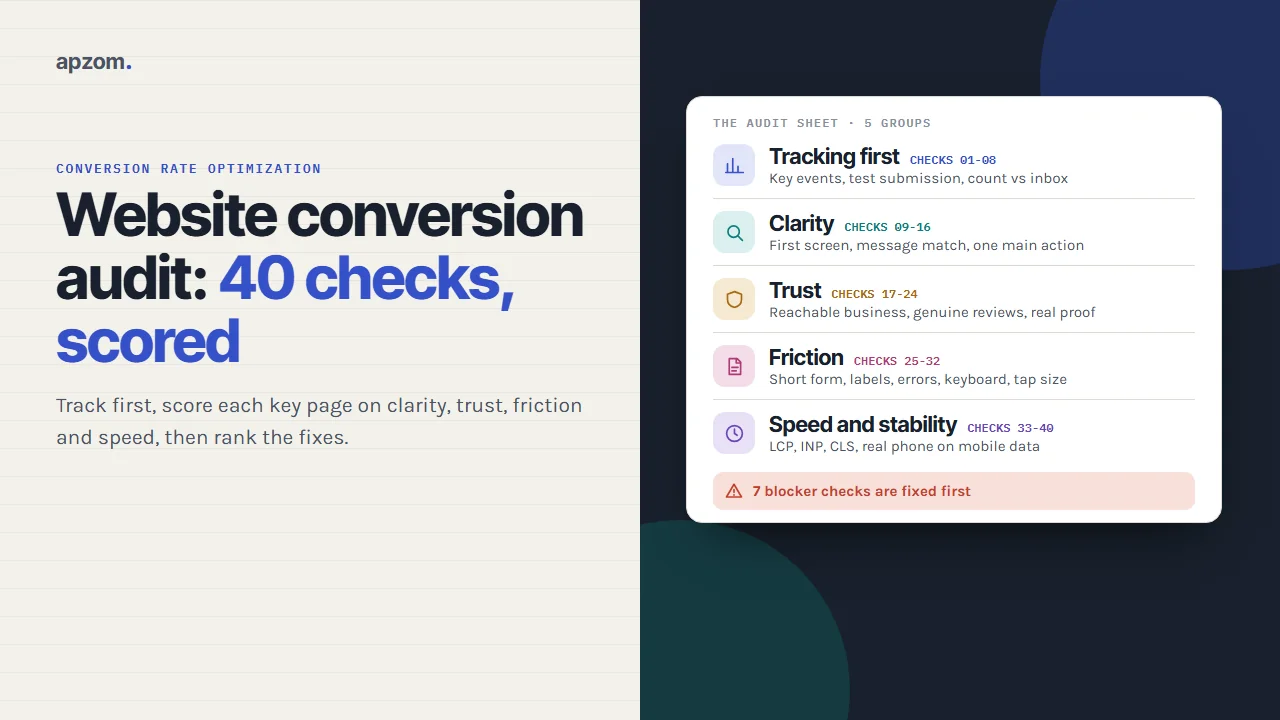
The short answer: A CRO audit is a structured check of the pages that should produce enquiries or sales, scored against a fixed list so you can see what to fix first. Check tracking before anything else, because every later judgement depends on it. Then score each key page on clarity, trust, friction and speed, fix the blockers that stop visitors from acting, and rank the other failures by reach, severity and effort. The result is a fix list, not a report that sits in a folder.
This guide is for owners, marketing leads and in-house web teams anywhere in the world who want to audit their own site, or check an audit an agency has sent them. It covers page choice, evidence, the 40 checks, scoring, prioritising and re-checking. We checked the Core Web Vitals thresholds, the WCAG 2.2 criteria, the Google Analytics and Search Console features and the review rules cited here against official sources on 19 November 2026.
What a CRO audit is, and what it is not
Conversion rate optimization (CRO) is the ongoing work of finding out why the right visitors do not act and fixing the causes; our guide to what conversion rate optimization is explains it. An audit is the first step: a snapshot of where the site loses people today.
What an audit is not:
- Not a design review. “It looks dated” is not a finding. A finding names a page, a failed check and the evidence.
- Not a marketing audit. To check every channel before hiring an agency, use our digital marketing audit. This one covers only what happens once a visitor is on your site.
- Not a one-symptom diagnosis. If the site gets visits and no enquiries at all, start with our five tests for a website that is not generating leads, then come back here.
Before you start: choose the pages and gather the evidence
Pick three to five pages, not the whole site
Pick the pages that carry most potential buyers:
- Your top entry pages that sell something. In Google Analytics 4 (GA4), the Landing page report sits under Reports, then Engagement, then Landing page (if it is missing from the menu, an editor can add it back). Pick the top two or three service, product or landing pages by sessions.
- The page where the action happens: usually your contact, booking, quote or checkout page.
- Your home page, if it is a common entry point.
If you run paid campaigns, include the page each main campaign sends people to: leaks there cost money every day.
Gather the evidence pack
Each check needs evidence, not opinion. Collect this first:
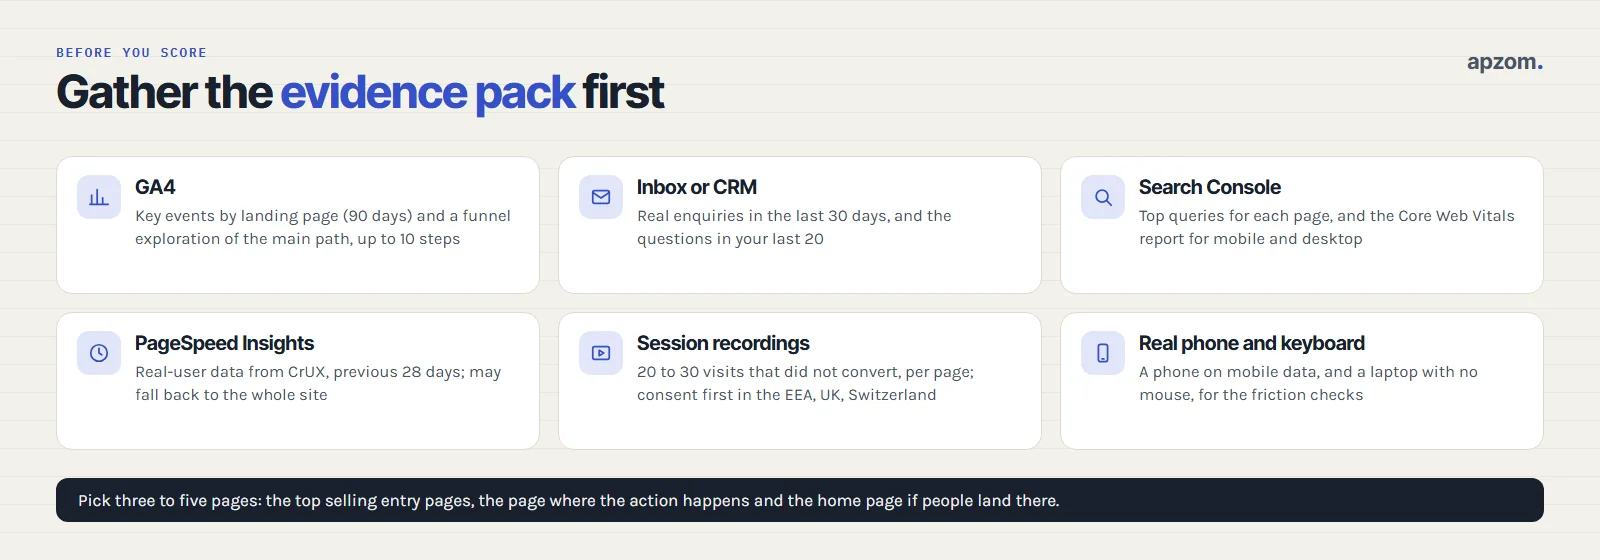
- GA4: key events by landing page for the last 90 days, and a Funnel exploration for your main path. Google says a funnel exploration lets you “visualize the steps your users take to complete a task”, with up to 10 steps.
- Your inbox or CRM: the real number of enquiries, bookings or orders in the last 30 days, to compare with GA4.
- Search Console: the top queries for each page (Performance report, filtered by page) and the Core Web Vitals report for mobile and desktop. Our Search Console guide shows where both live.
- PageSpeed Insights: a run for each page. Google says its real-user data comes from the Chrome User Experience Report and covers “the previous 28-day collection period”; with too little data it falls back to whole-site figures, or shows none.
- Session recordings: 20 to 30 recordings per page of visitors who did not convert, from a tool such as Microsoft Clarity. Microsoft’s Clarity FAQ calls it “a free service forever” with no traffic limits.
- A real phone on mobile data, and a laptop with no mouse, for the friction checks.
- The last 20 enquiries or sales call notes, for the questions people ask first.
How to score: the audit sheet
Score each check for each page. The tracking checks apply to the whole site; score those once.
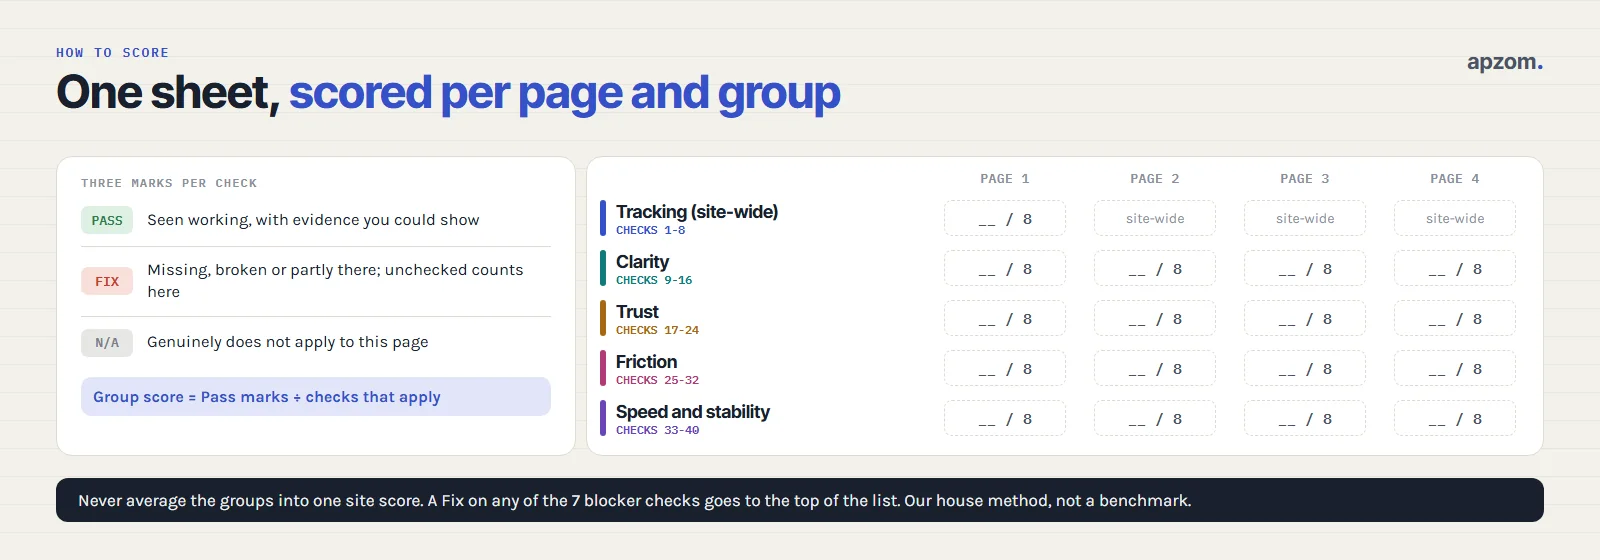
Use three marks:
- Pass: you have seen it working yourself, with evidence you could show someone else.
- Fix: it is missing, broken or only partly there. “I think the developer set that up” is a Fix until you have checked it.
- N/A: the check genuinely does not apply, such as a form check on a page with no form.
Then work out a group score for each page: Pass marks divided by the checks that apply, so a page passing 5 of 8 clarity checks scores 5/8. Do not average the groups into one site score: a fast, clear site can still lose most of its enquiries to one broken form, and an average hides that.
Seven checks are marked (blocker). A Fix on a blocker goes to the top of the list whatever the scores say, because it stops visitors from acting or stops you seeing whether they did.
The scores are our house method for deciding what to fix first, not an industry benchmark, and they cannot be compared between companies.
| Group | Checks | Page 1 | Page 2 | Page 3 | Page 4 |
|---|---|---|---|---|---|
| Tracking (site-wide) | 1 to 8 | /8 | Site-wide | Site-wide | Site-wide |
| Clarity | 9 to 16 | /8 | /8 | /8 | /8 |
| Trust | 17 to 24 | /8 | /8 | /8 | /8 |
| Friction | 25 to 32 | /8 | /8 | /8 | /8 |
| Speed and stability | 33 to 40 | /8 | /8 | /8 | /8 |
Copy the table into a spreadsheet and add an evidence note beside every Fix.
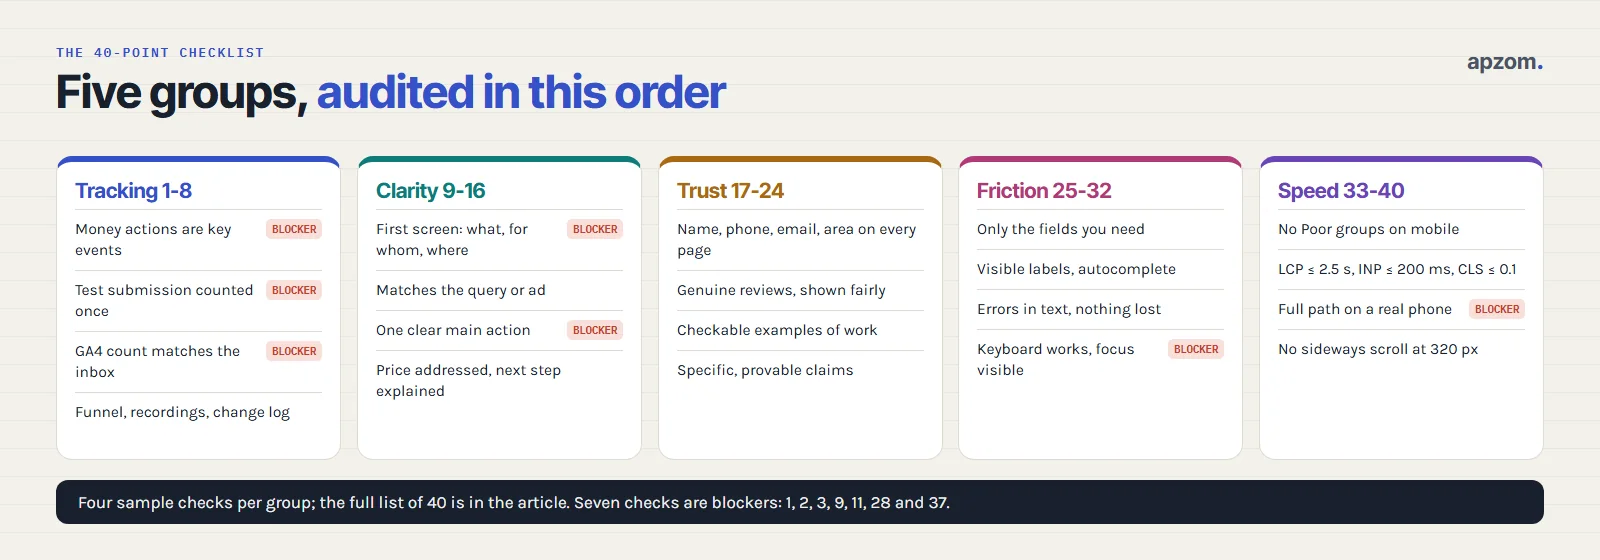
The 40-point CRO audit checklist
Work through the groups in this order: a page that seems to improve while the counting is broken has not improved at all.
Tracking first (checks 1 to 8)
- Each action that makes money is a key event in GA4 (blocker). A submitted enquiry, a completed booking, a purchase or a tracked call; clicks on a phone link are signals, not conversions. You mark an event as a key event under Admin, Data display, Events, by clicking the star next to it. Standard properties can mark up to 30 events as key events, so keep the list short. Google says marking an event “doesn’t change historic data”, so counting starts from that day.
- A test submission is counted exactly once (blocker). Send a test enquiry through every form, then check GA4’s Realtime report: one key event, not zero and not two. Then submit with an error on purpose: if GA4 counts the failed attempt, your numbers are inflated. Enhanced measurement can record form_submit events, but test it; a thank-you page view, which happens only on success, is often more reliable.
- GA4’s count roughly matches what arrived (blocker). Compare the last 30 days of key events with the enquiries in your inbox or CRM. A large gap either way means the counting cannot be trusted yet; spam, double-firing tags and thank-you pages people can load directly are common causes. Expect GA4 to read lower where visitors decline analytics cookies.
- Calls, WhatsApp and email clicks are tracked separately from form leads, so you see which routes people use without counting every tap as a lead.
- You can see key events by landing page, so you know which pages produce enquiries.
- A funnel exploration exists for the main path, such as service page, contact page, thank-you page. The step where most people leave tells you where to look hardest.
- Session recordings are running, with consent where it is required. Microsoft says Clarity needs explicit consent before it places cookies for visitors in the European Economic Area, the UK and Switzerland, and that without it features such as full session recordings are limited. It masks input boxes in every mode; check the masking setting for pages that show personal data.
- There is a change log: a shared sheet dating every page change, campaign launch and tracking change, so you can later tell why numbers moved.
Our guides to setting up Google Analytics 4 and Google Tag Manager for beginners cover the set-up behind checks 1 to 5.
Clarity (checks 9 to 16)
Ask someone who does not know your business to look at each page on a phone for ten seconds, then say what you sell, for whom, where, and what to do next. Their hesitations are findings.
- The first screen on a phone says what you do, for whom and where (blocker). “Solutions that deliver results” fails; “Commercial roof repairs for warehouses in the Midlands” passes.
- The page matches what sent people there. Compare the headline with the top Search Console queries for that page and the ads that point to it. Our guide to landing page best practices explains message match in depth.
- There is one clear main action, visible without scrolling on a phone (blocker). The button says what happens (“Get a quote”, “Book a 15-minute call”), not “Submit” or “Learn more”.
- Price is addressed: a price, a range, a starting point or an honest note on what it depends on.
- The page says what happens after someone gets in touch: who replies, how quickly and what comes next. Our guide to speed to lead explains why reply time matters.
- Every service you sell has its own page, and the menu uses customers’ words, not internal names. Our guide to writing a service page covers the structure.
- The questions repeated in your last 20 enquiries are answered on the page.
- Text is easy to read. Body text has a contrast ratio of at least 4.5:1 against its background (WCAG 2.2 success criterion 1.4.3, Level AA), and nothing important exists only inside an image.
Trust (checks 17 to 24)
- The business is identifiable and reachable: a trading name, phone number, email address, and an address or clear service area, in the same place on every page. WCAG 2.2 success criterion 3.2.6, Consistent Help (Level A), asks that help options such as contact details appear in the same order relative to other page content on each page where they are repeated.
- Real people are named, with their roles, where a buyer would want to know who they will deal with.
- Reviews are genuine and shown fairly. In the US, the Federal Trade Commission’s rule on consumer reviews and testimonials, in force since 21 October 2024, bans fake reviews and testimonials, buying reviews you know or should know are fake, and offering incentives for reviews that must express a particular sentiment. In the UK, the Competition and Markets Authority’s fake reviews guidance (CMA208, April 2025) says a trader may infringe the law by suppressing genuine negative reviews or selectively promoting positive ones. In the EU, the Unfair Commercial Practices Directive, as amended by Directive (EU) 2019/2161, treats information on whether and how you check that published reviews come from real customers as material information. Our guide to getting more Google reviews covers collecting them.
- Examples of work are specific and checkable: named clients who agreed to be named, real project photos, and outcomes you could prove. Our guide to writing a case study shows how.
- Licences and certifications show their scope where your trade has them: the number, the issuing body and what is covered. A bare badge proves little.
- Claims are specific and provable. Remove “best”, “number one” and “trusted by thousands” unless you can show evidence; in many countries unprovable claims can be misleading advertising.
- The privacy notice is linked beside the form, and every page loads over HTTPS. Search Console’s HTTPS report shows pages that fail the second part.
- The site looks maintained: no expired offers, broken links, “coming soon” sections or news pages that stopped years ago.
Want a second pair of eyes on your audit? Ask for a Free Growth Audit. We check your GA4 key events against real enquiries, score your main landing page and contact page, test the form on a phone and with a keyboard, and tell you which blockers we would fix first.
Friction (checks 25 to 32)
Do these on the real phone and on the laptop without a mouse. Our guide to contact form best practices goes field by field.
- The form asks only for what you need to reply. Anything you could ask on the first call should not be on the form.
- Every field has a visible label, not just placeholder text that disappears when someone types (WCAG 2.2 success criterion 3.3.2, Labels or Instructions, Level A). Personal-detail fields use the right input type and an autocomplete value, such as name, email, tel or organization (1.3.5 Identify Input Purpose, Level AA), so browsers can fill them and phones show the right keyboard.
- Errors are explained in text and nothing typed is lost. WCAG 2.2 asks that detected errors are identified and described in text (3.3.1, Level A) and that a correction is suggested where one is known (3.3.3, Level AA). A form that clears every field after one mistake fails.
- The whole path works with a keyboard alone (blocker). Tab through the page and the form: every link, field and button must be reachable and usable (2.1.1 Keyboard, Level A), the focus must be visible (2.4.7, Level AA), and a sticky header, cookie banner or chat widget must not entirely hide the focused field (2.4.11 Focus Not Obscured (Minimum), Level AA, new in WCAG 2.2).
- Buttons and links are easy to tap. WCAG 2.2’s minimum is a target of at least 24 by 24 CSS pixels, or enough spacing around a smaller one (2.5.8, Level AA).
- Phone numbers and email addresses are tappable text, not images, and the phone link uses the international format.
- Nothing covers the content on a phone. Google’s guidance on intrusive interstitials says not to “obscure the entire page with interstitials” and to use banners that take up “only a small fraction of the screen”. Legally required dialogs such as age checks are treated differently; a newsletter pop-up is not one.
- Multi-step forms, bookings and checkouts do not repeat themselves. They show progress, do not force an account where none is needed, and do not ask again for information already entered in the same process (WCAG 2.2 success criterion 3.3.7, Redundant Entry, Level A).
Where WCAG is a legal duty is covered in our guide to website accessibility requirements by country.
Speed and stability (checks 33 to 40)
Google’s web.dev guidance sets the “good” Core Web Vitals thresholds at the 75th percentile of page loads, measured separately on mobile and desktop. Our Core Web Vitals guide explains each metric and the fixes.
- The Search Console Core Web Vitals report shows no Poor groups on mobile for the pages you audit. Google says the report uses real-world data, groups similar URLs and gives each group the status of its worst metric.
- Largest Contentful Paint is 2.5 seconds or less in real-user data for the page or, if that is missing, for the site.
- Interaction to Next Paint is 200 milliseconds or less. A slow response to taps on menus, accordions or form fields is friction even when the page loads quickly.
- Cumulative Layout Shift is 0.1 or less, and the main button and form do not jump when a cookie banner, image or review widget loads.
- The full path works on a real phone on mobile data (blocker). Load the page, open the menu, fill in the form and submit it. Lab scores simulate one device; this tells you whether a real visitor can finish.
- Nothing scrolls sideways at a narrow width. WCAG 2.2 success criterion 1.4.10, Reflow (Level AA), asks that content works without scrolling in two directions at a width equal to 320 CSS pixels. Wide tables, images and maps are the usual causes.
- Every third-party script earns its place. Remove unused chat widgets, old ad tags and embeds.
- Error pages lead somewhere. A missing page shows your main services and a way to get in touch, not a dead end.
Google’s page experience guidance says Core Web Vitals “are used by our ranking systems”, and that good results in its reports do not guarantee top rankings. For an audit, the point is that a slow or jumpy page loses people ready to act.
Prioritise the fixes
An audit of four pages can easily produce 40 Fix marks. Do not work down from check 1; sort them.
Step 1: blockers first
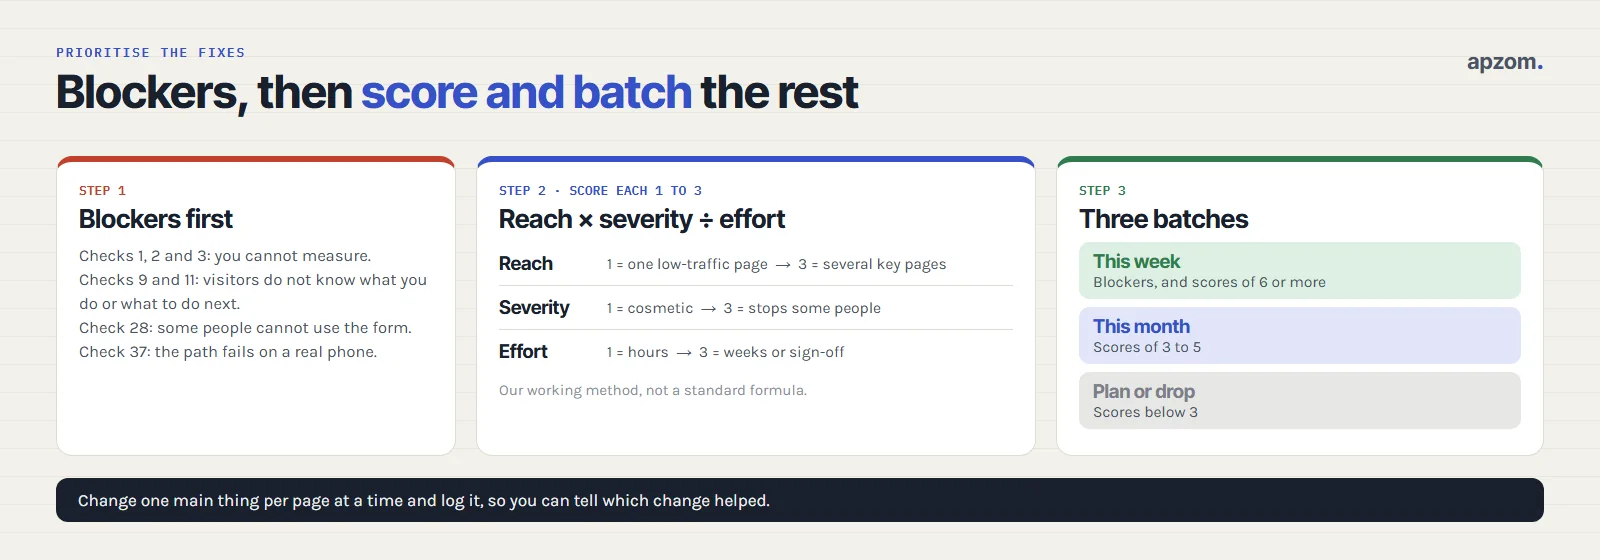
Fix every blocker first: checks 1, 2 and 3 (you cannot measure), 9 and 11 (visitors do not know what you do or what to do next), 28 (some people cannot use the form) and 37 (the path fails on a real phone). Most are small jobs that later fixes depend on.
Step 2: score the rest on reach, severity and effort
For every other Fix, give three scores from 1 to 3:
| Score | Reach: who it affects | Severity: what it does | Effort: what the fix takes |
|---|---|---|---|
| 1 | One low-traffic page | Cosmetic or a minor annoyance | Hours |
| 2 | One key page or one device | Slows people or makes them doubt you | Days |
| 3 | Several key pages or most visitors | Stops some people from acting | Weeks, or a developer and sign-off |
Then work out priority = reach × severity ÷ effort. A problem on every key page that stops some people and takes hours to fix scores 3 × 3 ÷ 1 = 9. A cosmetic issue on one page that needs weeks of work scores 1 × 1 ÷ 3, about 0.3. This is our working method, not a standard formula; it forces you to write down why one fix comes before another.
Step 3: put the fixes into three batches
- This week: blockers, and anything scoring 6 or more.
- This month: anything scoring 3 to 5.
- Plan or drop: anything below 3. Deciding not to do some of these is a useful result.
Change one main thing per page at a time and note it in the change log (check 8), or you will not know which change helped. If several pages need heavy work, our guide to signs your website needs a redesign helps you decide whether to rebuild.
Write it up as a one-page fix list
The output is a list someone can act on, not a slide deck. One row per finding:
| Check | Page | Evidence | Fix | Owner | Priority | Re-check date |
|---|---|---|---|---|---|---|
| 27 | Contact | Form cleared all fields after an invalid phone number (tested on a phone) | Keep entered values; show the error next to the field in text | Web developer | Blocker batch | After the fix goes live |
That row is an illustrative example, not a finding from a real site. Keep evidence specific (what, which device, which date); “form UX could be improved” never gets fixed.
After the fixes: re-score and measure
Re-run the checklist on the same pages four to eight weeks after the main fixes go live (our working interval), on a new sheet beside the old one, and watch two things:
- Did the group scores rise? That shows the fixes were made, not that more people converted.
- Did the key events change? Compare equal periods before and after each change, with similar traffic sources, and check lead quality, not just the count. On a small site a few enquiries either way can be chance; our guide to A/B testing with low traffic explains how to read small numbers.
Repeat the full audit after a big change, such as a new site, form tool or main campaign. Otherwise our working rhythm is a quarterly re-check, plus the tracking checks after any plugin, form or tag change.
What a checklist audit cannot tell you
A checklist finds common, fixable problems. Its limits:
- It cannot judge the offer. If the price, area or product is wrong for the visitor, every check can pass and people still will not buy.
- It cannot say why people leave. Recordings show where they hesitate; talking to customers and lost prospects tells you why.
- A Pass is not a result. Passing all 40 makes problems less likely; it promises no conversion rate.
We give no conversion-rate benchmarks: published averages mix industries, offers and definitions. Your own baseline from check 3 is the number to compare against.
Common mistakes
- Auditing only the home page. Many people who are ready to act land on a service or campaign page instead.
- Auditing on a laptop only. Many friction and speed failures appear only on a phone.
- Fixing everything at once. Several changes in one week leave you unable to say which one helped.
- Treating best practice as proof. A failed check is a likely problem, not a measured one.
How Apzom can help
Our conversion rate optimization service starts with this kind of audit: we check the tracking, score your key pages, watch recordings and test the forms on real devices, then hand over a prioritised fix list with the evidence for every row. We can make the fixes, or leave the list with your team. We have not published a CRO case study yet, so we will not show you conversion figures we cannot prove or promise a percentage lift; you can see the work we have published on our case studies page. We work with clients worldwide, remotely, from our base in Ahmedabad, India.
Get a Free Growth Audit and Quote for your key pages. Send us the three to five pages that should bring in enquiries or sales, and tell us how leads reach your team today. We send back a scored audit sheet, the evidence for every finding and a prioritised fix list, with a quote if you want us to make the fixes.
No obligation, and no promised conversion rate or uplift. Prefer to talk first? Contact us or see our conversion rate optimization service.
Frequently asked questions
How long does a CRO audit take?
For a small site with three to five key pages, our working estimate is half a day to two days, mostly spent gathering evidence and testing forms on real devices. Sites with many templates, languages or checkout steps take longer.
Can I do a CRO audit myself?
Yes. Every check here works with free tools: Google Analytics 4, Search Console, PageSpeed Insights, Microsoft Clarity, a phone and a keyboard. Bring in help when fixes need a developer or tracking is badly broken.
How is a CRO audit different from an SEO audit?
An SEO audit asks whether search engines can find, understand and rank your pages. A CRO audit asks whether the people who arrive can understand you, trust you and act. Speed and mobile checks overlap. Our technical SEO audit guide covers the search side.
What should I ask for if an agency runs the audit?
Ask for the scored sheet, the evidence behind every finding, the blockers listed separately and a prioritised fix list with owners. A single overall score is hard to act on.