The short answer: A/B testing in marketing compares two versions of a page, email or ad by showing each to a random half of your visitors. With low traffic, a test can only detect big differences, so before you start, work out the smallest change your traffic can detect in a few weeks. If the answer is “the page would need to double its conversion rate”, do not test a new button colour. Test a bold change, measure a step higher up the funnel, or skip the split test and use methods that work with few visitors: session recordings and heatmaps, five-person usability checks, customer interviews, form analytics and carefully logged before-and-after changes. If you do run a test, follow Google’s testing guidance so it does not affect your search results.
This guide is for owners and marketers of small and mid-sized websites anywhere in the world, especially service, B2B and lead-generation sites with a few hundred or a few thousand visitors a month on key pages. It shows how to calculate what your traffic can detect (formula, spreadsheet version and worked example), how to choose between testing and research, how to run before-and-after changes honestly, privacy rules for recording tools by country, the main types of testing tool, and how to test without hurting SEO. We checked the Google, Microsoft, Meta and privacy-law points against official sources on 19 November 2026; where an official page would not load, we kept the wording cautious.
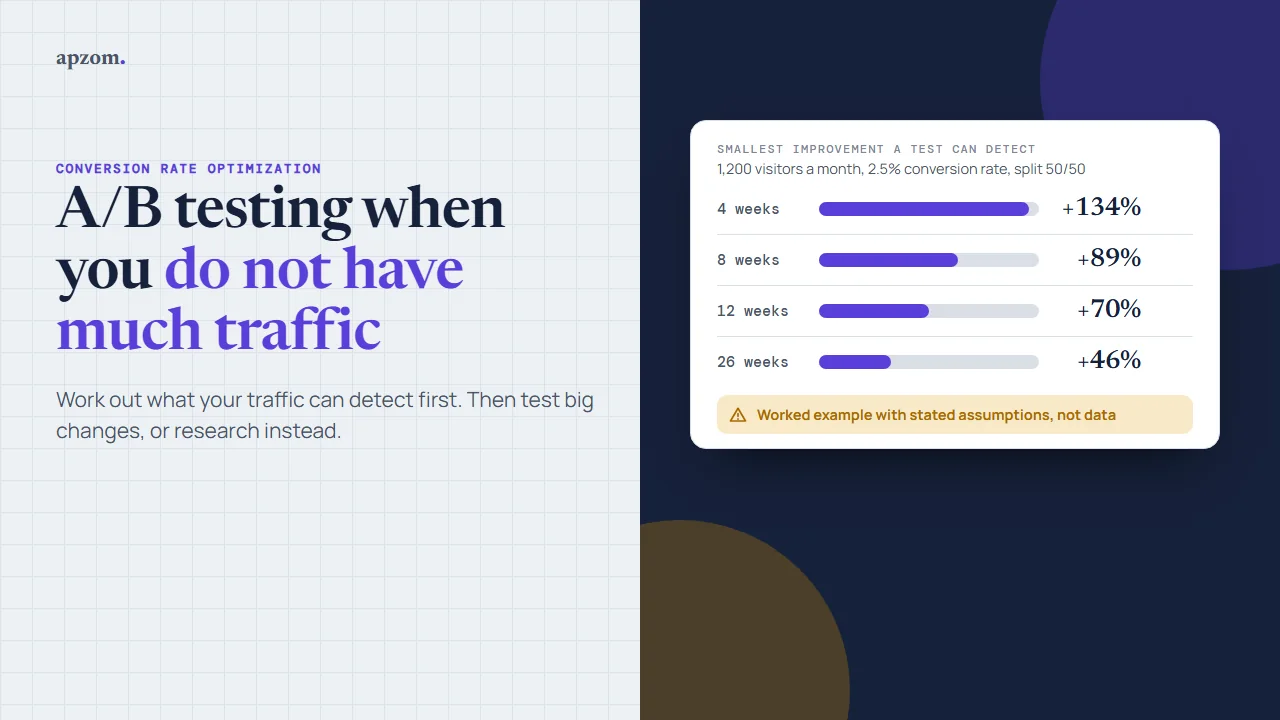
Why low traffic breaks A/B tests
Every conversion rate moves around by chance. If 1,000 people see a page and 25 enquire, the next 1,000 might produce noticeably more or fewer with nothing changed. An A/B test has to tell a real difference apart from that random movement, and the smaller the real difference, the more visitors it needs to see it through the noise.
The number that matters is not visitors but conversions. A page with 1,200 visitors a month and a 2.5% conversion rate produces about 30 enquiries a month. Split that in half for a test and each version gets about 15 a month. No method, however clever, can reliably tell whether 15 or 17 enquiries is a real improvement.
Our guide What Is Conversion Rate Optimization explains which CRO methods suit which traffic levels. This guide starts from the traffic you actually have and shows what you can learn from it.
Work out what your traffic can detect
Do this before you design any test. It takes ten minutes and can save months of waiting for a result that was never going to arrive.
Step 1: collect three numbers
- Baseline conversion rate of the page or step you want to improve, from at least the last eight weeks. In GA4 that is the key event (for example a form submission) divided by the sessions or users on that page. Our guide to setting up Google Analytics 4 shows how to set up key events if you have not yet.
- Weekly visitors to that page, averaged over the same period.
- How long you can wait. Four to eight weeks is realistic for most businesses; longer tests pick up seasonal, campaign and site changes that muddy the result.
Step 2: use the standard formula
The usual way to size a test that compares two conversion rates is the two-proportion sample-size formula. With the common settings (95% confidence, which means a 5% chance of a false winner when there is no real difference, and 80% power, which means an 80% chance of detecting a real difference of the size you chose), visitors needed per version are:
n = (1.96 + 0.84)² × [p1 × (1 − p1) + p2 × (1 − p2)] ÷ (p2 − p1)²
Here p1 is your current conversion rate and p2 is the rate you hope the new version reaches, both written as decimals (2.5% is 0.025). In Excel or Google Sheets, put p1 in cell A1 and p2 in cell B1 and use this formula:
=(NORM.S.INV(0.975)+NORM.S.INV(0.8))^2*(A1*(1-A1)+B1*(1-B1))/(B1-A1)^2For a quick check without a spreadsheet, Lehr’s rule of thumb gives almost the same answer: n ≈ 16 × p × (1 − p) ÷ d², where p is the average of the two rates and d is the difference between them. Any two-proportion sample-size calculator should agree closely.
Step 3: a worked example
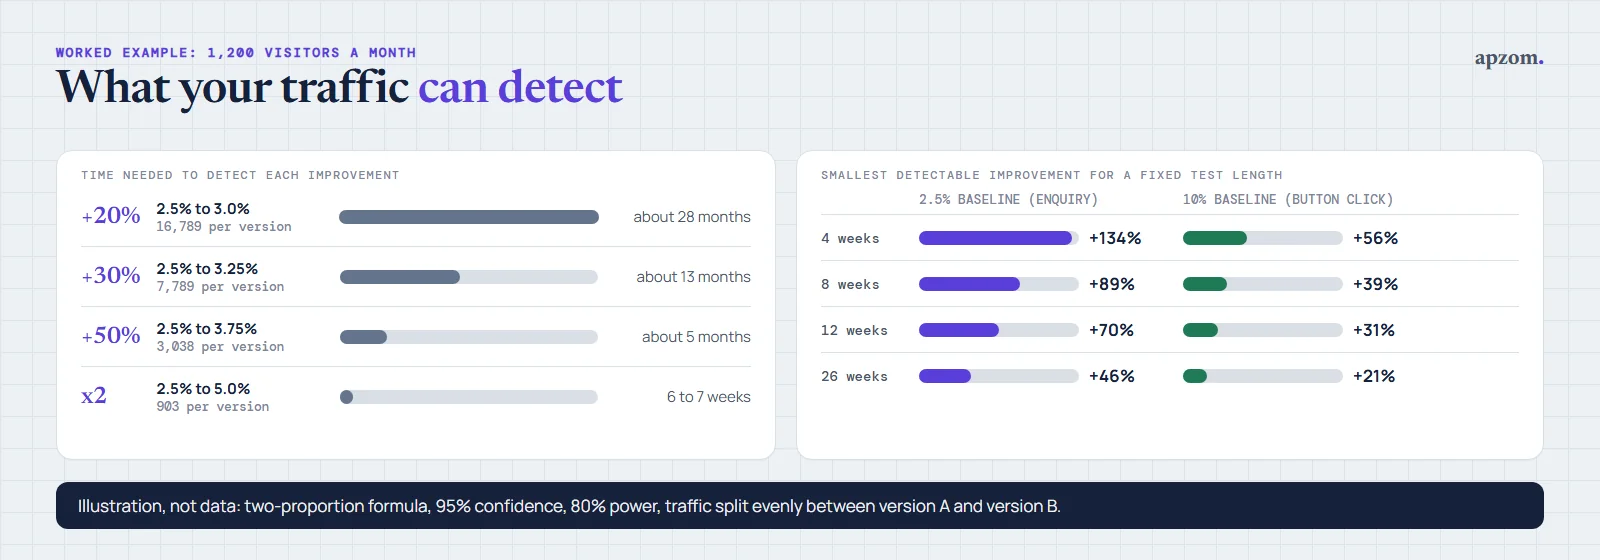
This is an illustration with stated assumptions, not a benchmark or client data. Assume a quote page gets 1,200 visitors a month, split evenly between two versions, and converts at 2.5%. We ran the formula above for several sizes of improvement.
| Improvement you want to detect | Conversion rate change | Visitors per version | Time at 1,200 visitors a month |
|---|---|---|---|
| 20% better | 2.5% to 3.0% | 16,789 | About 28 months |
| 30% better | 2.5% to 3.25% | 7,789 | About 13 months |
| 50% better | 2.5% to 3.75% | 3,038 | About 5 months |
| Twice as good | 2.5% to 5.0% | 903 | About 6 to 7 weeks |
Now turn it round. If you can wait a fixed time, what is the smallest improvement this page can detect?
| Test length | Visitors per version | Smallest detectable improvement (2.5% baseline) | Same traffic, 10% baseline |
|---|---|---|---|
| 4 weeks | About 550 | About 134% (more than double) | About 56% |
| 8 weeks | About 1,100 | About 89% | About 39% |
| 12 weeks | About 1,660 | About 70% | About 31% |
| 26 weeks | About 3,600 | About 46% | About 21% |
The last column shows the same traffic measured against a step that converts at 10%, such as clicks on the “Get a quote” button. A higher baseline rate needs fewer visitors, which is why the alternatives below often move the measurement up the funnel.
Two lessons follow. Halving the improvement you want to detect roughly quadruples the visitors you need. And at low traffic, only big changes are testable. Small tweaks, such as a new button colour, rarely produce effects that large, so a site like this one cannot detect them in any useful time.
Why “significant” results on small sites are often wrong
At 95% confidence, about one test in twenty where nothing really changed still shows a “significant” winner by chance. Checking every day and stopping when one version looks ahead pushes that rate well above 5%; our CRO guide explains this “peeking” problem. And when a test is too small for a realistic effect, the results that do cross the line tend to overstate the true difference, because only the lucky extremes get there. So when a small test does report a “+60%” winner, treat it as weak evidence: the real difference is probably much smaller, and may be close to zero.
Decide: test, change and measure, or research first
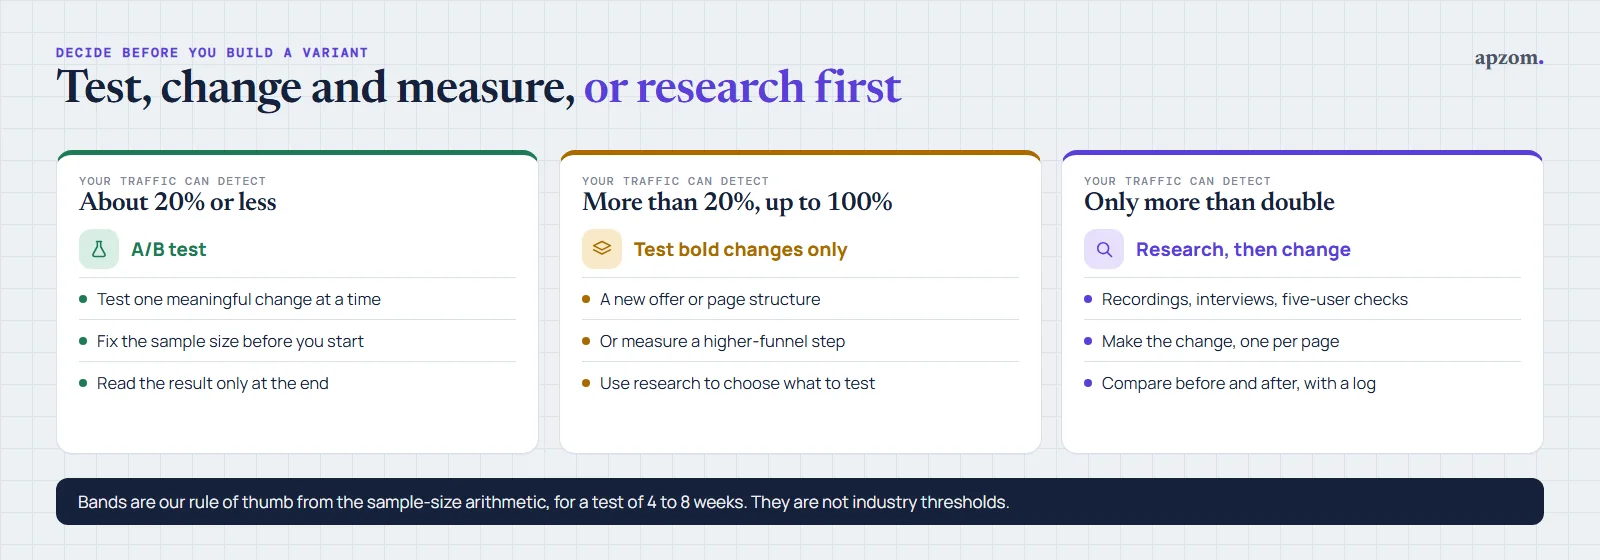
Once you know the smallest improvement you can detect, the choice is usually clear.
| What your traffic can detect in 4 to 8 weeks | What to do |
|---|---|
| Improvements of about 20% or less | A/B testing can work. Test one meaningful change at a time, with the sample size fixed in advance |
| Improvements of more than 20% and up to 100% | Test only bold changes (a new offer, a new page structure), or test a higher-funnel step; use research to choose what to test |
| Only improvements of more than double | Do not split test. Use research to find problems, make the change, and measure before and after with a log |
These bands are our rule of thumb from the arithmetic above, not industry thresholds. A page like the worked example sits in the second or third row, and that is fine.
Option 1: test bigger, bolder changes
If your traffic can only detect large effects, give it large changes to measure: what the visitor is offered, or how the page argues its case. Examples for a lead-generation site:
- A different offer: a free audit or site visit instead of “contact us”, or a price guide instead of “request a quote”.
- A different page structure: proof and pricing near the top instead of at the bottom, or a short page against a long one.
- A different form approach: a two-step form (one question first, contact details second) against a single long form.
- A different message: the page leads with the outcome the customer wants instead of a description of your company.
The trade-off is that a winning bold version tells you the package works, not which part did the work. That is acceptable when the goal is more enquiries. Our landing page best practices guide lists the parts of a lead-generation page that are worth changing first.
Option 2: measure a step higher up the funnel
The worked example showed that a 10% baseline needs far fewer visitors than a 2.5% baseline. So instead of waiting for enquiries, measure an earlier step that happens more often: clicks on the main call-to-action button, visits to the contact page, or people who start the form.
This is faster, with one serious caveat: a version can win more clicks and still produce the same enquiries, or worse ones. Use the earlier step to choose between versions, then check the final outcome (enquiries, and their quality in your CRM) before you treat the change as a success.
Option 3: before-and-after changes with a log
On many small sites, the practical method is to make one meaningful change, then compare an equal period before and after. This is not an A/B test: the periods have different visitors, weeks and possibly campaigns, so it cannot prove the change caused the difference. Run carefully and written down, it is still useful evidence.
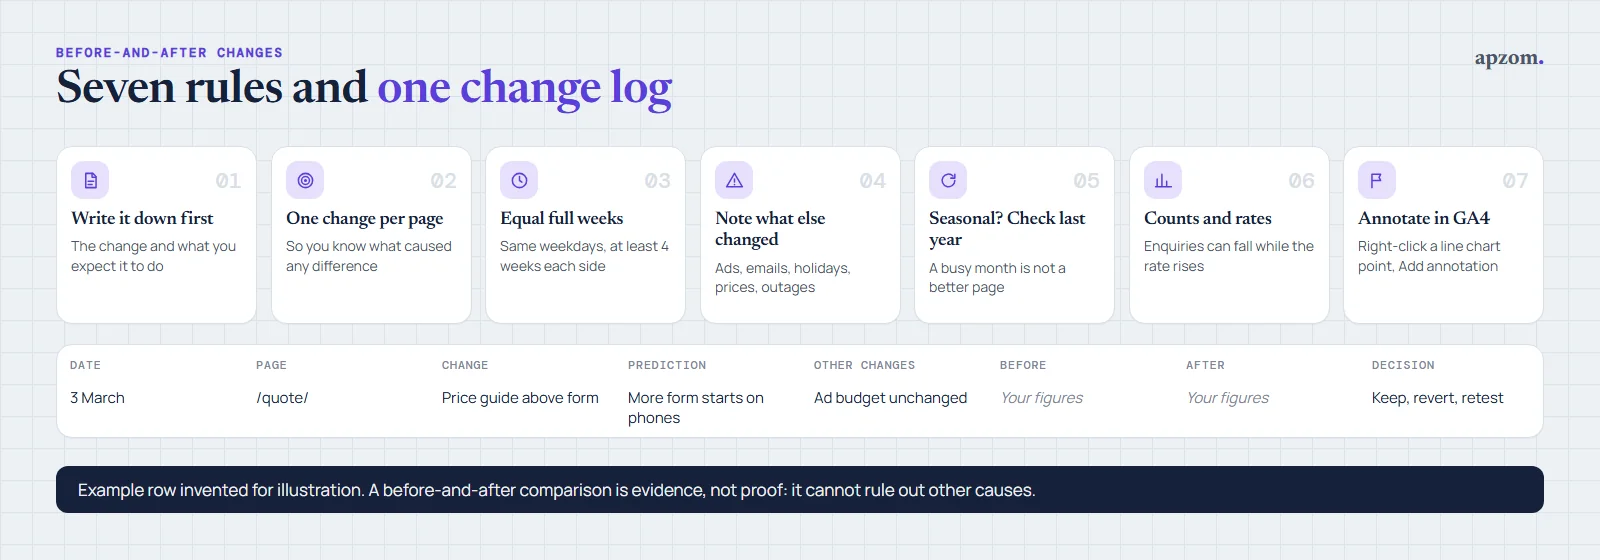
- Write the change and your prediction first. For example: “Move the price guide above the form; we expect more form starts on phones.”
- Make one change per page at a time. If you change the headline, the form and the offer in the same week, you will never know which one mattered.
- Compare equal periods. Use full weeks, the same number of each weekday, and at least four weeks either side where traffic allows.
- Check what else changed. Note ad budget changes, new campaigns, email sends, holidays, price changes, site outages and anything else that could move results.
- Compare with last year if your business is seasonal, so a busy month is not mistaken for a better page.
- Track counts as well as rates. If traffic falls, the conversion rate can rise while total enquiries fall.
- Mark the change in GA4. Google Analytics Help explains that you can add an annotation by right-clicking a data point on a report’s line chart and choosing Add annotation; you need the Analyst role or above, and each property can hold up to 1,000 annotations.
Keep the log in a shared sheet with these columns. Here is one filled-in row, invented for illustration:
| Date | Page | Change | Prediction | Other things that changed | Before (4 weeks) | After (4 weeks) | Decision |
|---|---|---|---|---|---|---|---|
| 3 March | /quote/ | Price guide moved above the form | More form starts on phones | Ad budget unchanged; one email send in both periods | Enter your real figures | Enter your real figures | Keep, revert or retest |
Record the changes that made no difference too. Over a year, the log becomes evidence of what works on your own site.
Not sure whether your traffic can support an A/B test? Ask for a Free Growth Audit. We check your GA4 key events and form tracking, work out the smallest improvement your key pages can detect, and tell you which changes to test, which to make and measure, and which research to run first.
Option 4: preference tests and five-second tests
Some questions do not need live traffic at all. Two quick methods work with a handful of people who match your customers:
- Five-second test: show someone the page for five seconds, hide it, and ask what the business offers, who it is for and what they could do next. If they cannot say, your first screen is not doing its job.
- Preference test: show two versions side by side and ask which one they would trust more, and why. The “why” is the useful part; the vote from a few people is not a statistical result.
Jakob Nielsen’s article “Why You Only Need to Test with 5 Users” (Nielsen Norman Group, 2000) argues that about five participants find most usability problems, that several small rounds beat one large study, and that the rule holds for users who are similar to each other. Give each person a realistic task, such as “find out what this costs and ask for a quote”, and watch where they hesitate. It tells you what is wrong, not how much a fix will help.
Option 5: session recordings and heatmaps
Recordings replay how real visitors scroll, click and move through a page; heatmaps add those actions up across many visits. They work at any traffic level because you look for patterns, not percentages. Watch 20 or 30 recordings of visitors who did not convert and note where they stop, scroll back and forth, or tap something that is not a link.
Microsoft Clarity is one free option; Microsoft’s documentation describes it as “a free service forever”. Its documentation also says input-box content is masked in every masking mode, that the default Balanced mode also masks numbers and email addresses, and that recordings are kept for 30 days, with some kept longer. Whichever tool you use, check what a recording shows before you rely on the defaults.
Recording tools store or read information on the visitor’s device, so privacy rules apply. This is general information, not legal advice:
| Market | What to know |
|---|---|
| EU and EEA | Article 5(3) of the ePrivacy Directive generally requires consent before storing or reading information on a visitor’s device, unless it is strictly necessary for a service they asked for; GDPR applies to the personal data collected. Since 31 October 2025, Clarity enforces consent signals for EEA visits and does not set cookies without valid consent |
| UK | PECR applies. The Data (Use and Access) Act 2025 added a narrow exception for some statistics cookies, with conditions, including a free and simple way to object. Do not assume it covers a third-party recording tool; check the ICO’s guidance on storage and access technologies. Clarity enforces consent signals for UK visits |
| Switzerland | Clarity enforces consent signals for Swiss visits, as for the EEA and UK |
| India | The Digital Personal Data Protection Act 2023 and its Rules, notified in November 2025, phase in notice and consent duties over 18 months |
| US | Rules differ by state. Clarity’s automatic consent enforcement covers only EEA, UK and Swiss visits, so check the privacy laws of the states you serve |
| Australia, Canada, UAE | Covered by their own privacy laws (Australia’s Privacy Act 1988, Canada’s PIPEDA, the UAE’s Federal Decree-Law No. 45 of 2021); check each before you record visitors |
Microsoft notes that its October 2025 change “does not introduce new consent requirements”: it enforces rules that already applied. Put the tool behind your consent banner, name it in your privacy notice, and expect fewer recordings where many visitors decline.
Option 6: customer interviews and sales calls
Recent customers, and people who nearly bought, can tell you more about a page than most tests. Ask five to ten recent customers the two questions in our CRO guide (what nearly stopped them, and what the website did not tell them), plus one that points to a page change: “Which part of the page did you read before you got in touch?” Ask your sales team or front desk which questions come up on every first call.
Turn the answers into page changes (asked about price: add a price guide; worried about timing: add a timeline), then log each change as in Option 3. Interview notes are evidence, not statistics.
Option 7: form analytics
On many lead-generation sites, the form is where people give up. Form analytics compares how many people start it with how many finish.
In GA4, the Form interactions option of enhanced measurement records a form_start event the first time a user interacts with a form in a session and a form_submit event when the form is submitted, according to Google’s Analytics Help. Check that the option is switched on under Admin, Data streams, your web stream, Enhanced measurement. Google notes that parameters such as the form ID only appear in reports if you create custom dimensions for them.
Check it before you rely on it: compare form_submit counts with the enquiries that actually reached your inbox or CRM over the same days. If they do not match, track the thank-you page or a confirmation event instead; our guide to Google Tag Manager for beginners covers setting up and testing a tag. Once they match, the gap between starts and submissions shows whether the form itself is losing people.
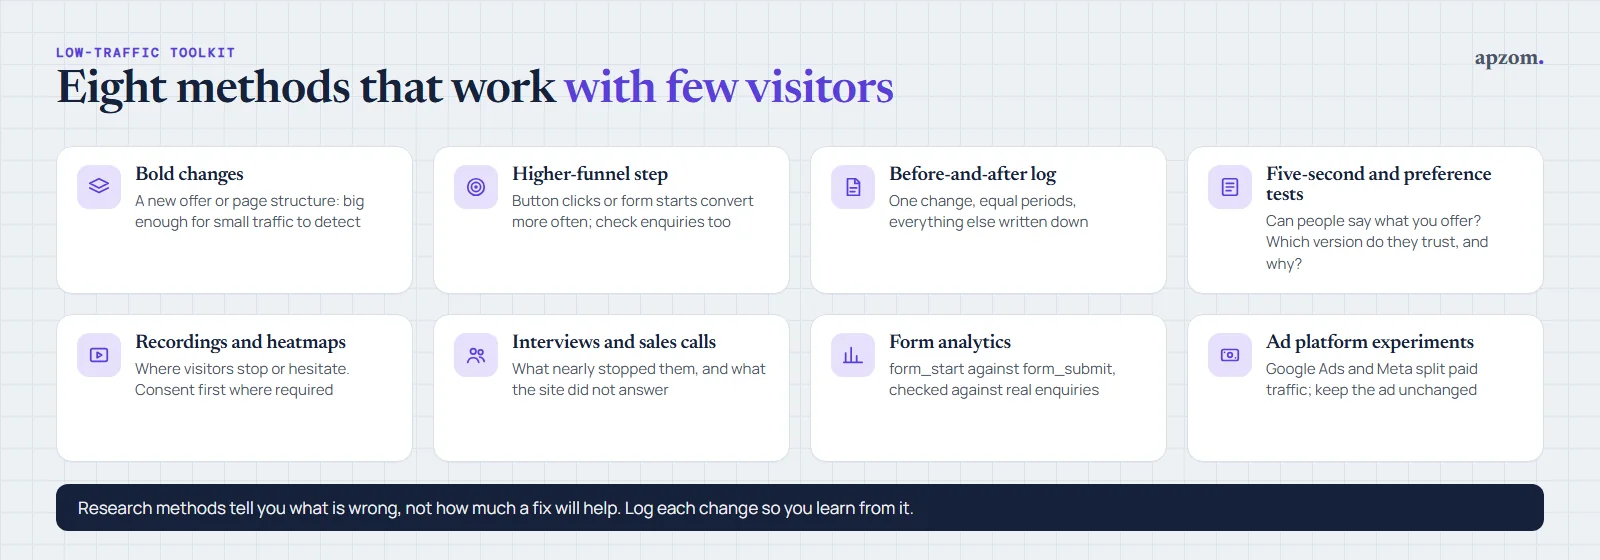
Use the ad platforms’ built-in experiments
If you buy ads, the platforms can split the paid traffic for you. Google Ads Help says custom experiments let you test changes to Search, Display, Demand Gen and Video campaigns against the original, and that a 50/50 split controls auction eligibility but does not guarantee equal impressions or spend. Google suggests allowing 7 to 14 days for the trial arm to stabilise. Meta Ads Manager has an A/B test feature that shows each version to a separate group of people.
The same arithmetic limits apply, but you can test landing pages this way: send the trial campaign to the new page, keep the ad unchanged, and compare enquiries.
A/B testing tools after Google Optimize
Google Optimize, the free tool many small sites used, stopped working on 30 September 2023. Google’s Analytics Help page says Optimize and Optimize 360 “are no longer available as of September 30, 2023”, lists AB Tasty, Optimizely and VWO as the testing providers it is building integrations with, and says its APIs are open so any testing tool can connect to Google Analytics. We mention those names because Google lists them, not as a recommendation.
Decide which kind of tool fits your site before you compare brands:
| Tool type | How it works | Good for | Watch for |
|---|---|---|---|
| Visual or client-side testing tools | A script changes the page in the visitor’s browser | Marketers testing copy and layout without a developer | Possible page flicker and extra script weight; follow Google’s testing guidance |
| Server-side and feature-flag tools | Your server or app decides which version to send | Developers testing larger changes, apps and checkouts | Needs development time |
| Split tests built into your website or landing page builder | The builder serves two versions and counts results | Small sites already on a builder that includes it | Check how the builder counts a conversion |
| Ad platform experiments | Google Ads or Meta split the paid traffic | Testing landing pages for paid traffic | Only covers paid visitors |
| Recording, heatmap and survey tools | Show behaviour and ask visitors questions | Research at any traffic level | Consent rules by country |
Check each vendor’s current features and prices on its own website; they change often.
How to run a test without hurting SEO
Google’s Search Central guidance, “Minimize A/B testing impact in Google Search”, sets out the rules. In short:
- No cloaking. Google says “Don’t show one set of URLs to Googlebot, and a different set to humans.” Let Googlebot be assigned to a version like any visitor.
- Use rel=”canonical” on variant URLs, pointing to the original page. Google recommends this rather than a noindex tag.
- Use a 302 (temporary) redirect, not a 301, if visitors are redirected to a variant URL. Google adds that JavaScript-based redirects are also fine. Our guide to 301 vs 302 redirects explains the difference.
- End the test promptly. Google says to “remove all elements of the test as soon as possible” once it is over, and warns that running an experiment for an unnecessarily long time may be read as an attempt to deceive search engines. It gives no fixed number of days.
Google also notes that small changes “often have little or no impact” on a page’s snippet or ranking: a reassurance, not a promise.
Common mistakes
- Testing before doing the maths. Calculate the smallest detectable improvement first; a test that was never big enough cannot give you an answer.
- Stopping when one version looks ahead. Fix the sample size or end date before you start, and only read the result then.
- Changing several things at once outside a test. In a before-and-after comparison, one change per page at a time is the only way to learn anything.
- Judging on clicks or form starts alone. Check enquiries and lead quality before you keep a change.
- Recording visitors without consent where it is required. Put recording tools behind your consent banner and name them in your privacy notice.
- Leaving test code and variant URLs live. Remove them when the test ends.
How Apzom can help
Apzom Digital’s conversion rate optimization service starts with measurement and research, not with a testing tool. We check your GA4 key events and form tracking, calculate what your traffic can detect, review recordings and form data with consent set up correctly, and give you a ranked list of changes with a plan for each: a properly sized test where your traffic allows it, and a logged before-and-after change where it does not. We have not published a CRO or A/B testing case study yet, so we will not quote results we cannot prove. We work with clients worldwide, remotely, from our base in Ahmedabad, India.
Get a Free Growth Audit and Quote for your key pages. Send us your website and the pages that matter most. We send back a written plan: what your traffic can detect, the changes we would make first, how we would measure each one, and a quote if you want us to do the work.
No obligation, and no promised conversion rates. Prefer to talk first? Contact us or read our guide to conversion rate optimization.
Frequently asked questions
How much traffic do I need to A/B test?
It depends on your conversion rate and the size of improvement you want to detect, not on a fixed visitor count. Use the formula in this guide: at a 2.5% conversion rate, detecting a 20% improvement takes about 16,800 visitors per version, while detecting a doubling takes about 900. If your page cannot reach the number you need in four to eight weeks, use research and before-and-after changes instead.
How long should an A/B test run?
Until it reaches the sample size you calculated before you started, in whole weeks so every weekday is covered equally. If the calculation says many months, test a bolder change or a higher-funnel step instead.
Is a before-and-after comparison as good as an A/B test?
No. An A/B test splits visitors at random at the same time, so outside events affect both versions equally. A before-and-after comparison cannot rule out other causes, such as a new campaign or a season. It is still useful at low traffic if you change one thing at a time and log everything else that changed.