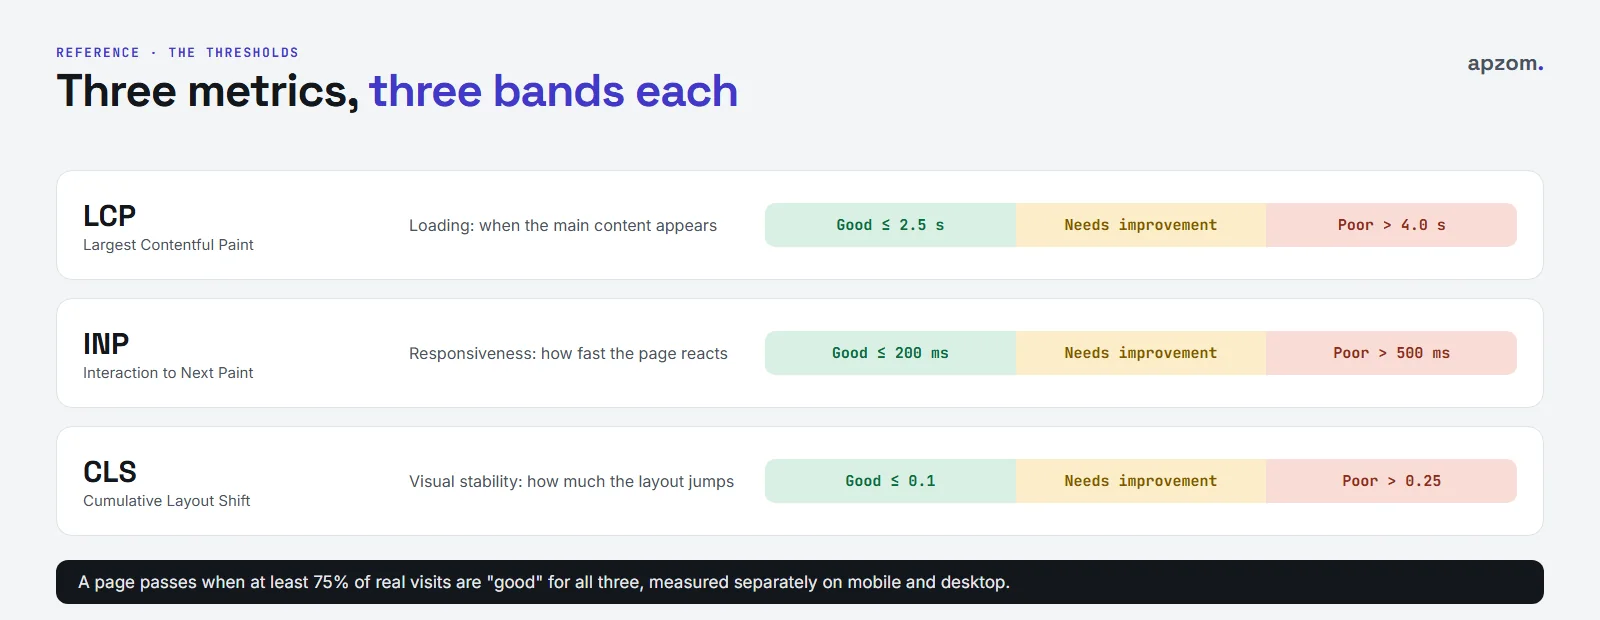
The short answer: Core Web Vitals are three measurements Google uses to describe how a page feels to real visitors. Largest Contentful Paint (LCP) measures loading: a good page shows its main content within 2.5 seconds. Interaction to Next Paint (INP) measures responsiveness: a good page reacts to taps and clicks within 200 milliseconds. Cumulative Layout Shift (CLS) measures visual stability: a good page scores 0.1 or less. A page passes when at least 75% of real visits are good on all three, measured separately for mobile and desktop. Judge your site by this real-user (field) data in Search Console or PageSpeed Insights, use lab tests to find the cause, and fix the biggest problem on your most important pages first.
This guide is for business owners, marketers and site managers anywhere in the world who have seen a “poor” or “needs improvement” warning and want to know what it means and what to do. It explains each metric in plain words, the difference between field and lab data, what usually causes each problem, and where to start on WordPress, Shopify and website builders. It follows Google’s own documentation on web.dev, Chrome for Developers and Search Central, and it does not quote speed statistics we could not trace to a primary source.
Why Core Web Vitals matter
They matter first for visitors. A page that loads slowly, ignores a tap or jumps as you try to press a button loses people, whatever its search ranking.
They matter for search too, but less than many people think. Google Search Central’s page experience guidance says Core Web Vitals are used by its ranking systems, but that relevance comes first and good scores do not guarantee rankings: a page with better content can still rank above a faster one. Google also says chasing “a perfect score just for SEO reasons may not be the best use of your time”. Treat Core Web Vitals as a way to make good pages easier to use, not as a shortcut to rankings.
For context, Google’s Chrome User Experience Report says 55.9% of websites (origins) had good Core Web Vitals in its September 2026 data.
The three metrics and their thresholds
| Metric | What it measures | Good | Poor |
|---|---|---|---|
| Largest Contentful Paint (LCP) | How long until the largest piece of content in view, often a hero image or heading, appears | 2.5 seconds or less | More than 4.0 seconds |
| Interaction to Next Paint (INP) | How quickly the page responds to taps, clicks and key presses, across the whole visit | 200 milliseconds or less | More than 500 milliseconds |
| Cumulative Layout Shift (CLS) | How much visible content moves unexpectedly while the page is in use | 0.1 or less | More than 0.25 |
Anything between good and poor is “needs improvement” (web.dev, Google’s “Web Vitals” guide). Google measures each metric at the 75th percentile of page visits, so a page is good when at least three in four visits meet the threshold, and it assesses mobile and desktop separately.
Each tool labels the middle band slightly differently: “Needs improvement” in PageSpeed Insights, “Need improvement” in Search Console, “Moderate” in Shopify and “Fair” in Wix.
INP is the newest of the three. It replaced First Input Delay (FID) as a Core Web Vital on 12 March 2024. FID only measured the delay before the first interaction; INP looks at responsiveness across every interaction in a visit, which is why some sites that passed before now show problems.
Change is still coming. In October 2026 Chrome’s real-user dataset added experimental versions of LCP, INP and CLS that also count page changes inside apps built as single-page applications (“soft navigations”). Google aims to make them official in May 2027, subject to feedback, and Search Console will then switch to them. Today’s scores and thresholds are unchanged.
Field data vs lab data
A common source of confusion is that the tools show two kinds of data.
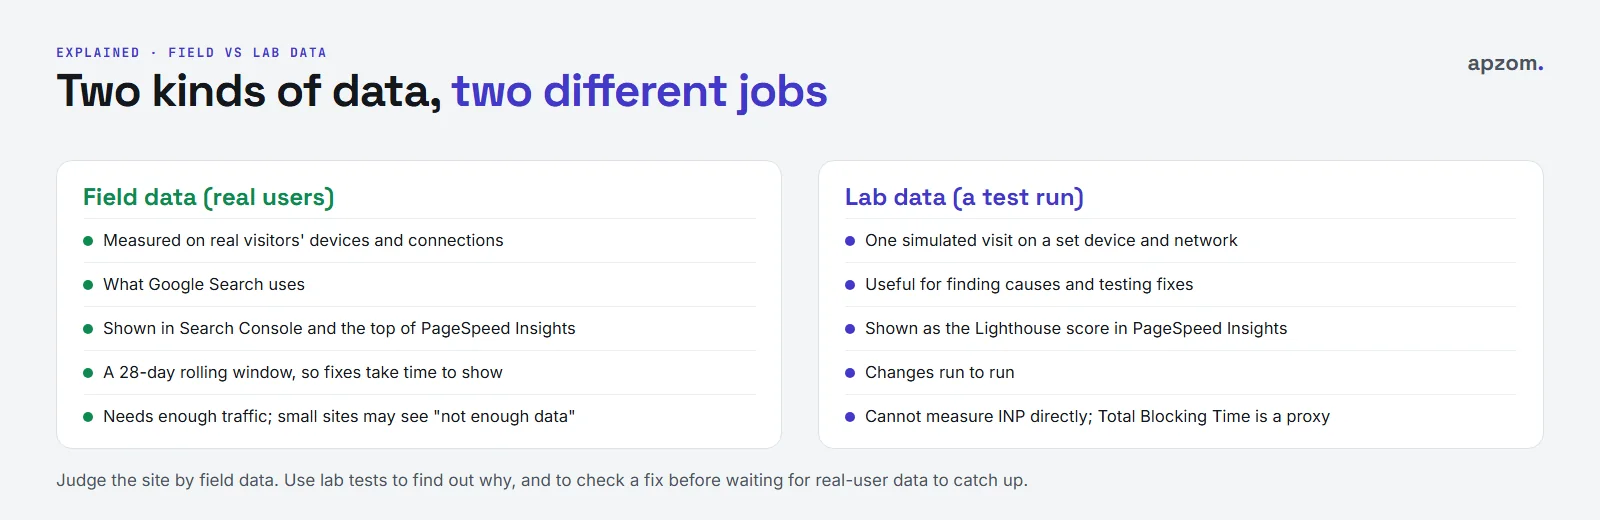
- Field data comes from real Chrome users visiting your site, collected in the Chrome User Experience Report (CrUX) over a rolling 28-day period. It is what Google uses for search, and it is what Search Console’s Core Web Vitals report and the top section of PageSpeed Insights show. Because it is a 28-day window, improvements take a few weeks to show.
- Lab data comes from a single simulated test, such as the Lighthouse test in PageSpeed Insights. It is useful for finding causes and checking a fix straight away, but its score can change from run to run and it is not what Google uses for ranking. A lab test cannot measure INP directly, because there is no real user interacting. Lighthouse uses Total Blocking Time as a stand-in, which web.dev says is not a substitute for INP. If a page has no INP field data, PageSpeed Insights can still pass its assessment on LCP and CLS alone.
Smaller sites may see “not enough data” in field reports, because there are not enough visits to measure. In that case, use lab tests as a guide and check again as traffic grows.
What usually goes wrong, and the fix
LCP: the main content appears too late
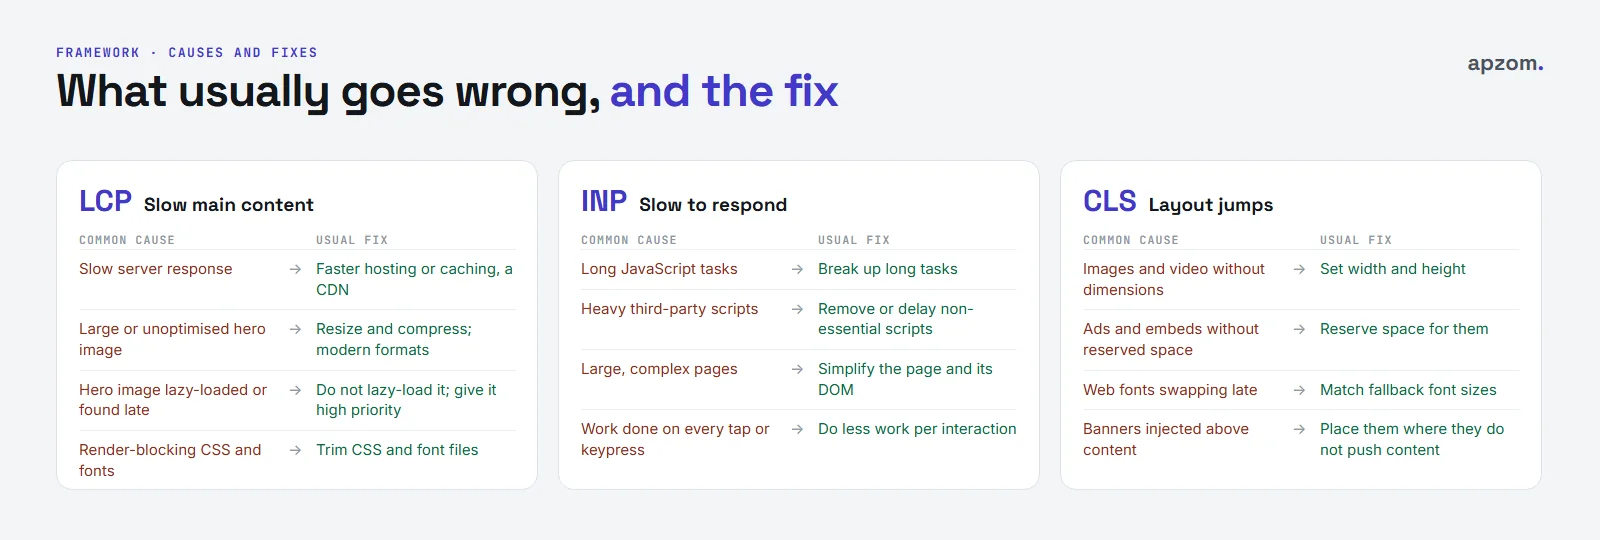
Common causes are a slow server response, a large or unoptimised hero image, a hero image that is lazy-loaded or discovered late, and CSS or fonts that block the page from showing. The usual fixes:
- Improve server response with better hosting, page caching or a CDN.
- Resize and compress the hero image and use a modern format.
- Do not lazy-load the main image, and let the browser know it is important (for example with a high fetch priority).
- Remove unused CSS and limit the number of font files.
INP: the page is slow to respond
INP problems usually come from too much JavaScript: long tasks that block the browser, heavy third-party scripts such as chat widgets, trackers and ad tags, and very large pages. The usual fixes:
- Remove scripts you do not need, and delay non-essential ones until after the page has loaded.
- Break up long JavaScript tasks so the browser can respond in between (a job for a developer on custom sites).
- Simplify very large or complex pages.
- Do less work each time someone taps or types, for example in search boxes and filters.
CLS: the layout jumps
Layout shifts come from images and videos without set dimensions, ads and embeds without reserved space, web fonts that swap in late and change text size, and banners or notices inserted above existing content. The usual fixes:
- Set width and height on images and video.
- Reserve space for ads, embeds and other late-loading content.
- Use fallback fonts adjusted to a similar size, or a font setting that avoids late swaps (a developer can use size-adjust or font-display: optional).
- Show banners where they do not push content down, for example overlaid or at the bottom.
Framework: where to start on your platform
You rarely control everything on a hosted platform, so start with what you can change.
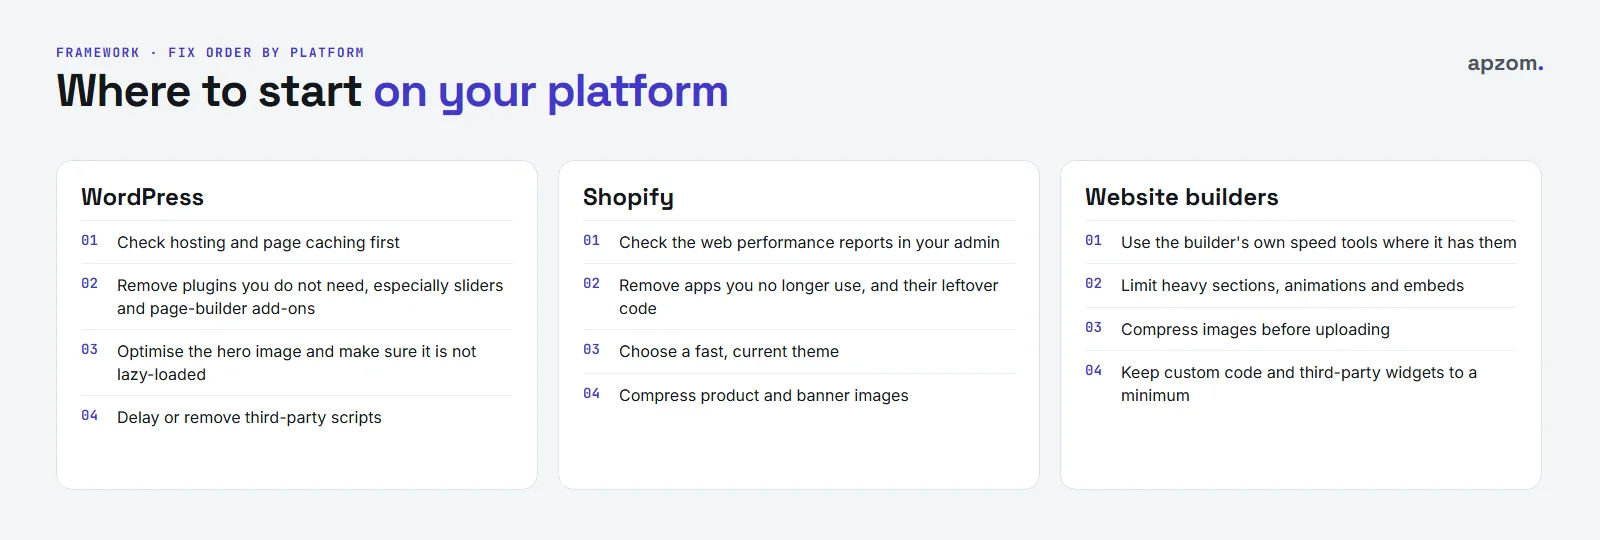
WordPress
- Hosting and caching first. A slow server affects every page. Check that page caching is on and that your hosting is adequate for your traffic.
- Plugins and page builders. Remove plugins you do not use, especially sliders and page-builder add-ons that load scripts on every page.
- The hero image. Compress and resize it, and make sure it is not lazy-loaded. Since version 6.3, WordPress automatically gives the likely main image a high fetch priority and avoids lazy-loading it (the WordPress team estimated a 5 to 10% LCP improvement from this change), but themes and plugins can override it. WordPress 6.8 also added speculative loading, which by default prefetches a page only when a logged-out visitor starts to click a link (it needs pretty permalinks). The official Performance Lab plugin offers more features, but describes itself as a beta-testing plugin.
- Third-party scripts. Delay or remove chat, tracking and social widgets you do not need.
Shopify
- Check your store’s web performance reports in the Shopify admin (under Analytics, then Reports), which show LCP, INP and CLS from real shoppers over the last 30 days. Shopify’s data includes Chromium browsers and Firefox, so it can differ from Google’s Chrome-only figures in Search Console. New stores and stores in private mode show no metrics, and staff need the Reports permission to see them.
- Apps. Remove apps that are not essential. Shopify notes that uninstalling an app does not automatically remove its code from your theme, so check for leftovers.
- Theme. A current, well-maintained theme is usually faster than an old or heavily customised one; Shopify describes its own Online Store 2.0 themes as optimised for web performance.
- Images. Compress product and banner images before uploading.
Website builders (Wix, Squarespace and others)
- Use the builder’s own tools. Wix’s Site Speed dashboard shows real-visitor Core Web Vitals from Wix’s own data, once a site has 10 or more sessions in the last 7 days. Squarespace’s help does not describe a Core Web Vitals dashboard, so use PageSpeed Insights and Search Console; its help focuses on page weight, such as keeping each page to 5 MB or less, images below 500 KB and no more than two fonts. On both, the platform handles hosting; your levers are what you put on the page.
- Limit heavy sections. Large video backgrounds, animations, carousels and embedded widgets slow pages down.
- Upload sensibly sized images. Wix resizes and converts images automatically; on Squarespace keep each image below 500 KB.
- Keep custom code to a minimum, especially third-party scripts and widgets.
Seeing poor or needs-improvement pages in Search Console? Ask for a Free Growth Audit. We check which page groups fail in real-user data, find the likely cause, and tell you what to fix first on your platform.
The tools, and when to use each
- Search Console, Core Web Vitals report: the starting point. Choose Core Web Vitals in the left menu, then open the Mobile report first. Only indexed pages appear in it. It groups similar URLs and shows which groups are poor, need improvement or are good, using field data. Our guide to how to use Google Search Console explains the reports.
- PageSpeed Insights: enter a single page address to see its field data (when available) and a lab test with specific suggestions.
- Chrome DevTools: the Performance panel shows live metrics as you use a page, which is useful for finding what slows down an interaction. It replaced the Web Vitals browser extension, which Google retired in January 2025.
- CrUX Vis: Google’s free tool for viewing weekly Chrome real-user data for a site over time, if the site has enough traffic to be in the Chrome dataset; it replaces the older CrUX Dashboard.
Fix the page groups that matter most to your business first, such as your home page, main service or product pages, and landing pages for ads. Our guide to doing a technical SEO audit puts Core Web Vitals in the context of the other technical checks.
Common mistakes
| Mistake | Why it hurts | Fix |
|---|---|---|
| Chasing a perfect lab score | Lab scores are not what Google uses, and vary between runs | Judge by field data; use lab tests to diagnose |
| Testing only on desktop | Mobile is assessed separately and is often slower | Check mobile first |
| Installing a “speed” plugin on top of others | Several plugins doing the same job can conflict or add weight | Use one caching or optimisation tool, configured carefully |
| Lazy-loading every image | The main image appears later, hurting LCP | Exclude the hero image from lazy loading |
| Expecting instant results | Field data covers 28 days | Check again a few weeks after a fix |
How Apzom can help
Apzom Digital improves Core Web Vitals as part of our SEO services and website development work: finding which pages and metrics fail in field data, tracing the cause with lab tools, and fixing what your platform allows, from images and caching to scripts and layout. We report progress with field data, not lab scores alone.
We work with clients worldwide, remotely, from our base in Ahmedabad, India.
Frequently asked questions
Are Core Web Vitals a ranking factor?
Google says Core Web Vitals are used by its ranking systems, but that it prioritises relevant, helpful content. Good scores help visitors and can help when many pages answer a query equally well, but they do not guarantee rankings: Google says it still shows the most relevant content even when its page experience is sub-par.
What is a good PageSpeed Insights score?
The headline score in PageSpeed Insights is a lab score from Lighthouse. It is useful for diagnosis, but Google’s Core Web Vitals assessment is based on field data, shown at the top of the report when available. Focus on passing the field assessment.
Why does Search Console say “not enough data”?
Field data needs a minimum number of real visits from Chrome users. Smaller sites or less-visited pages may not reach it; Search Console may then show data for a group of pages or for the whole site instead, or none at all.
How long until fixes show in Search Console?
Field data uses a rolling 28-day window, so it takes up to about four weeks for an improvement to be fully reflected. In Search Console you can then ask it to validate the fix for the affected group of pages.
Does INP affect sites without many interactions?
INP is measured when people interact with a page, for example tapping a menu, button or form field. Pages with few interactions may have less INP data, but menus, accordions and forms are common sources of problems.
Do I need a developer to fix Core Web Vitals?
Not always. On WordPress, Shopify and website builders, many fixes are settings, image changes and removing apps or plugins. Problems inside custom code or themes, especially INP, usually need a developer.
Get your Free Growth Audit and Quote. We review your Core Web Vitals field data (with your Search Console access, or from public PageSpeed Insights data), trace the main causes with lab tests, and send a plain-English fix list ordered by the pages that matter most to your business.
No obligation and no guaranteed rankings. Prefer to talk first? Contact us or see our SEO services.