The short answer: A useful marketing report answers five questions: what you spent, what it produced in business terms, what changed and why, what was done, and what happens next. It should show leads, qualified leads and, where you have them, sales, alongside spend and cost per qualified lead, compared with last month and the same month last year. It should also say which figures are still settling, because Google Analytics, Search Console and Google Ads all report recent days before they are complete. If a report cannot answer those questions on one page, it is a data dump, however many charts it has.
This guide is for business owners and managers who receive a monthly report from an agency or an in-house marketer, and for anyone writing one. It is about what a report should contain and how to read it. Our guide to measuring marketing ROI covers the measurement underneath. Apzom Digital is an agency that sends reports, so read this knowing we have an interest. The template works whoever does your marketing.

What to take from this guide
- Business results go first. Enquiries, qualified leads and sales come before impressions, clicks and followers.
- Every number needs a comparison. A figure on its own cannot tell you whether things are getting better.
- The last few days are always incomplete. A good report says so, rather than presenting a dip that will disappear.
- A report should end with a decision. If it never asks you anything, it is describing activity, not managing it.
The five questions every report should answer
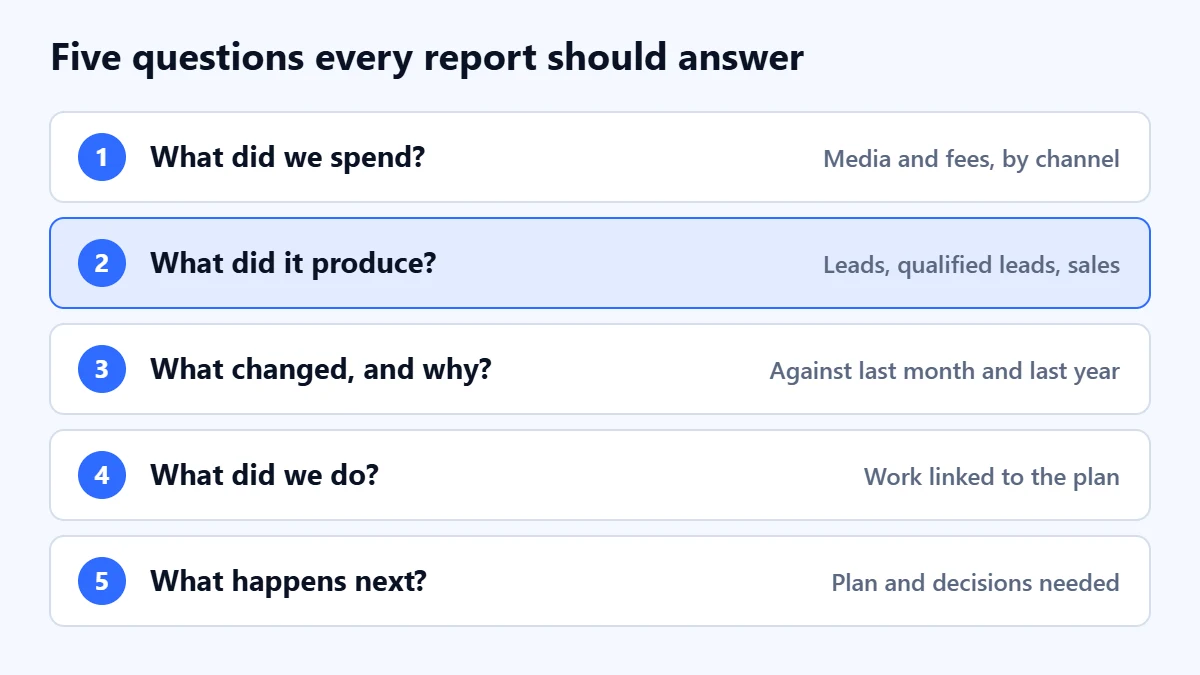
- What did we spend? Media spend by channel, plus fees, so the cost is never hidden in the small print.
- What did it produce? Leads, qualified leads and sales or revenue where your records allow, by channel.
- What changed, and why? The movement since last month and last year, with a reason that is evidence, not a guess.
- What did we do? The work completed, linked to what it was meant to achieve.
- What happens next? The plan for the coming month and any decision needed from you.
What goes in each section
1. A headline you can read in thirty seconds
Three or four sentences at the top: the result, the main reason for it, and the one thing that needs your attention. For example: “Qualified leads were up on last month at a similar spend. Most of the improvement came from search ads after we removed irrelevant searches. We need a decision on next month’s budget by the 10th.” If the headline is missing, you will end up reading the charts to work out the story yourself.
2. Business outcomes
This is the most important table in the report. Show it by channel, with last month and the same month last year beside it.
- Leads: enquiries by form, call, email or chat, counted from your own records where possible, not only from a platform.
- Qualified leads: the leads your team would actually pursue, using a definition agreed in advance. Our guide to improving Google Ads lead quality explains how to set one.
- Sales or revenue, where you can link them back to the source. If you cannot, the report should say so rather than estimate.
- Cost per qualified lead, because cost per lead rewards volume rather than quality.
3. Spend and efficiency by channel
Media spend per channel, management fees, and the cost per result for each. Paid and organic channels belong side by side, with organic costed honestly. Content and SEO cost money even though there is no per-click charge.
4. Leading indicators, clearly labelled
Search impressions, clicks, average position for priority pages, and engagement on key pages can show where results are heading, especially for SEO, which takes time. They belong in the report, but under their own heading and below the outcomes, so nobody mistakes a rise in impressions for a rise in business.
5. Work completed
A short list of what was done and why, linked to the plan. “Published two guides aimed at buyers comparing suppliers” is useful. “Ongoing optimisation” is not.
6. What we learned and what happens next
What worked, what did not, the plan for next month, and any decision needed from you, such as budget, approvals or access. This is the section that turns a report into a management tool.
7. Data notes
A few lines on anything that affects how the figures should be read: tracking changes, outages, a new attribution setting, or a period that is still settling. It is the section most reports leave out, and the one that prevents the most arguments.
Not sure your current reports tell you anything? Ask for a Free Growth Audit. We review your tracking, channels and reporting, and tell you what we would measure and what we would fix first.
Why last week’s numbers keep changing
This catches out more business owners than any other part of reporting. The most recent days in almost every marketing tool are incomplete, and they fill in afterwards. A report run on the 1st of the month will usually show the last few days of the previous month lower than they end up being.
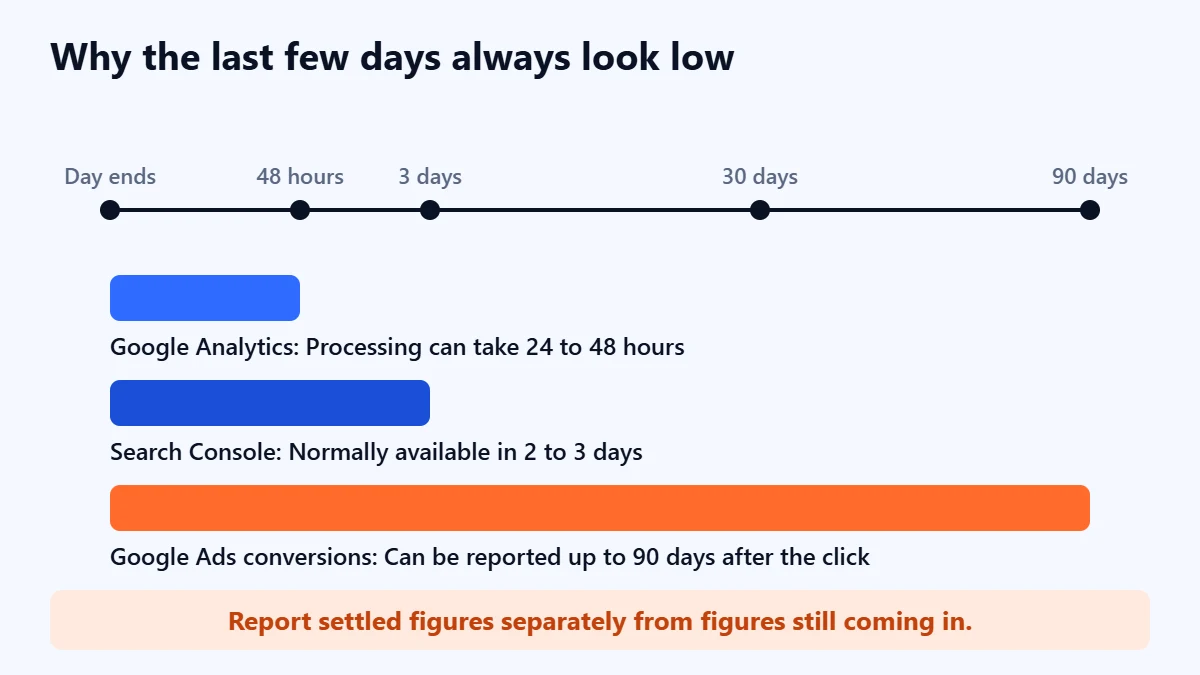
- Google Analytics: Google says data processing can take 24 to 48 hours, and that data in your reports may change during that time.
- Search Console: Google says collected data should normally be available in two to three days, and the newest data can be preliminary. It also labels each day using California time, which can shift figures by a day against your other systems.
- Google Ads: Google says conversions can be reported up to 90 days after the click, depending on your conversion window. It also reports conversions against the date of the ad rather than the day the conversion happened, so conversion lag can make recent cost per conversion look higher than it really is.
The practical fix is simple. In our judgement, a good report separates settled figures from those still coming in, and leaves recent days out of the comparison if they are clearly incomplete. If your sales cycle is long, compare months only once the conversions for the earlier month have had time to arrive.
Vanity metrics and business metrics
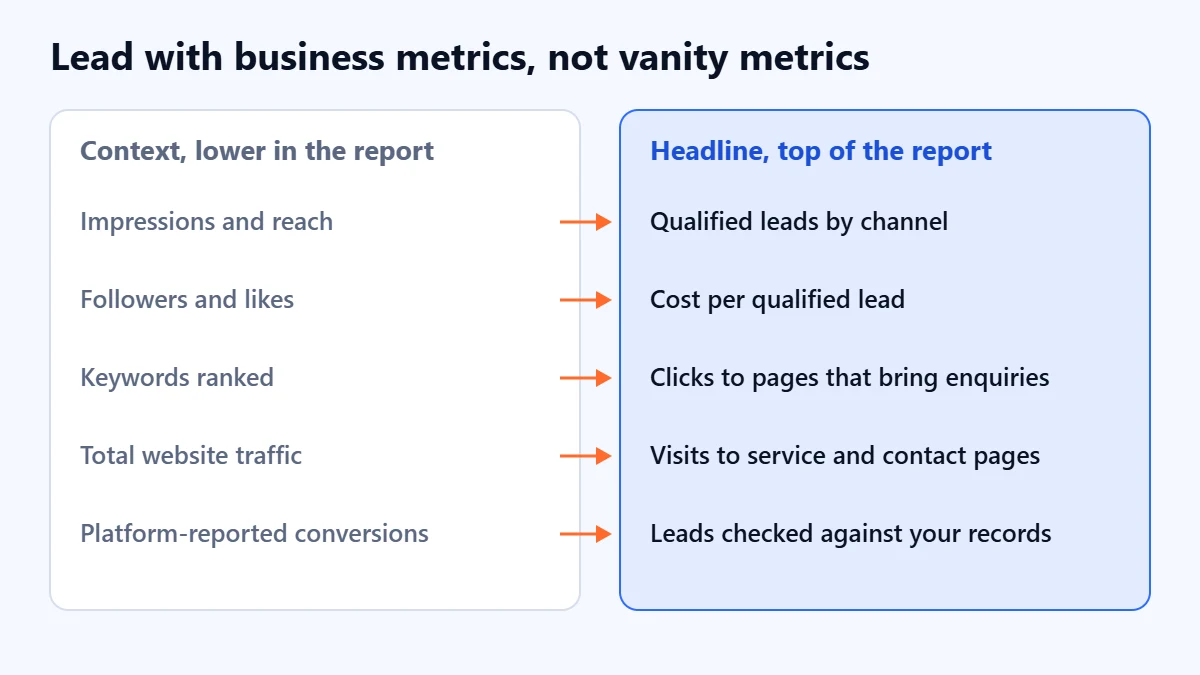
Some numbers rise easily and say little about whether marketing is paying for itself. They are not useless, but they belong lower in the report and should never be its headline.
| Often presented | What it really tells you | Ask for instead |
|---|---|---|
| Impressions and reach | How often something was shown | Enquiries and qualified leads from that channel |
| Followers and likes | Audience size and attention | Visits or enquiries that came from social |
| Number of keywords ranked | Breadth, including terms nobody buys from | Positions and clicks for the pages that bring enquiries |
| Total website traffic | Every visit, including people who were never buyers | Visits to service and contact pages, and the enquiries from them |
| Platform-reported conversions | What each platform believes it caused | Leads checked against your own records |
How to compare figures fairly
- Use the same month last year as well as last month. Many businesses are seasonal, and month-on-month changes can be the calendar rather than the marketing.
- Keep definitions fixed. If a lead was counted differently this month, the report should say so and restate the comparison.
- Be careful with small numbers. Moving from four enquiries to six is not proof of anything. Our guide to why a website is not generating leads shows how far small numbers can swing by chance.
- Do not add platform conversions together. Each platform tends to take credit for the same customer, so their totals often exceed the real number of leads.
A one-page template
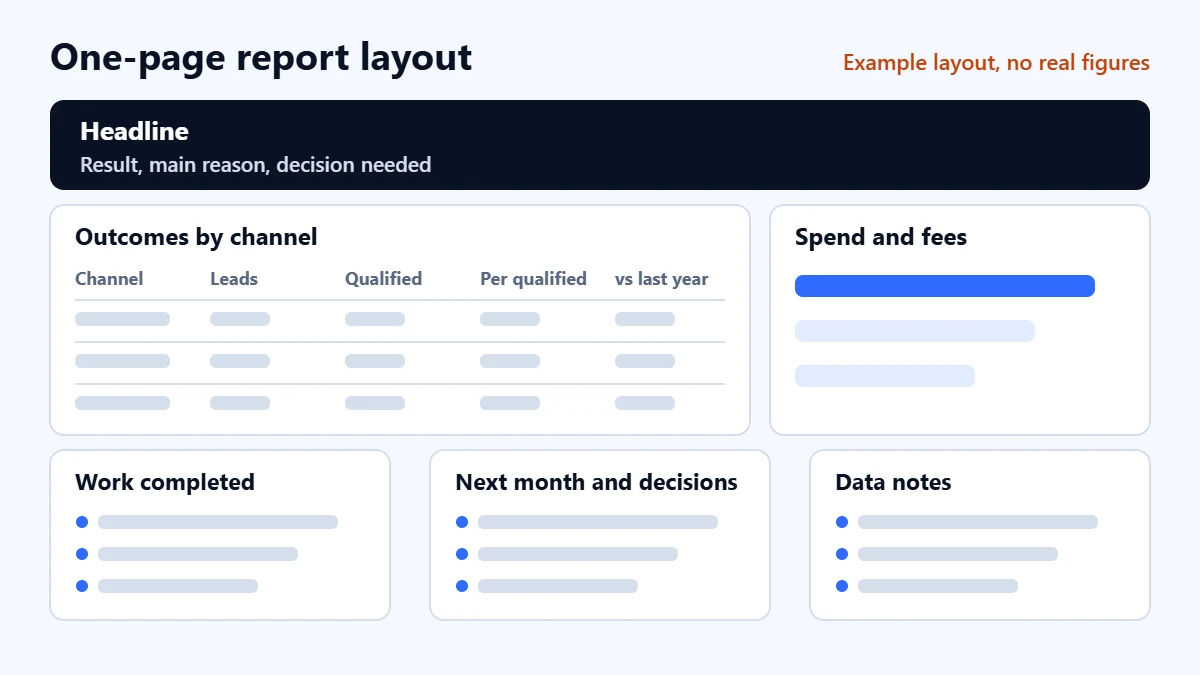
You can copy this structure into a document or spreadsheet. The example below shows the layout only, with no real figures.
| Section | Contents | Length |
|---|---|---|
| Headline | Result, main reason, decision needed | 3 to 4 sentences |
| Outcomes | Leads, qualified leads, sales and cost per qualified lead by channel, against last month and last year | One table |
| Spend | Media spend and fees by channel | One table |
| Leading indicators | Search visibility and engagement on key pages | A few lines |
| Work completed | What was done and why | Up to six bullets |
| Next month | Plan, tests and decisions needed | Up to six bullets |
| Data notes | Tracking changes and unsettled periods | A few lines |
How often should you get a report?
In our judgement, monthly suits most businesses, with a quarterly review of strategy and budget. If you spend heavily on ads, a short weekly check on spend and lead volume is worth having, but treat it as monitoring rather than a verdict, because the most recent days are always incomplete. A report more often than the data can support tends to create activity, not insight.
Red flags in an agency report
- No spend or fees. You cannot judge value without cost.
- The headline is impressions, reach or followers. These are useful context, not results.
- The metrics change from month to month. A good month is reported one way, a bad one another.
- You cannot check the numbers. You should be able to log in to your own ad accounts and analytics at any time. Our guide to choosing a digital marketing agency explains the ownership test.
- Rankings for terms nobody searches. A list of first-page keywords means little if none of them brings enquiries.
- No plan and no questions for you. A report that never asks for a decision is describing activity, not managing it.
Questions to ask about your next report
- How many qualified leads did we get, and how do you define qualified?
- What did each qualified lead cost, including your fee?
- Which figures are still settling, and when will they be final?
- Compared with the same month last year, are we better or worse, and why?
- What will you do differently next month as a result?
Frequently asked questions
What is the most important number in a marketing report?
For most service businesses, cost per qualified lead, shown alongside the number of qualified leads. It combines what you spent with what you actually got, and it is harder to flatter than impressions or clicks.
Why don’t the numbers in my report match Google Ads or Google Analytics?
Different tools count different things, on different dates, in different time zones. Google Ads dates a conversion to the ad rather than the day it happened, Search Console uses California time, and recent data in every tool is still being processed. The report should explain the gap rather than hide it. Our ROI guide covers why the numbers never fully match.
Should a report include rankings?
Yes, as a leading indicator for the pages that matter commercially, and never as the headline. Positions vary by location and device, so trends for priority pages are more useful than a long list of keywords.
How long should a monthly marketing report be?
One page for the summary, with supporting detail behind it for anyone who wants it. If the main points need more than a page, the report probably has not decided what matters.
Get your Free Growth Audit and Quote. Tell us what you are trying to achieve. We review your search visibility, paid media and website, and reply with what we would fix first, how we would report on it, and a realistic view of cost and timeline.
No obligation and no guaranteed results. Prefer to talk first? Contact us or see our digital marketing services.